We read with great interest the article by LIANG et al. [1] wherein the authors analysed the characteristics and diagnostic performance of oscillometry in adult patients with asthma (n=781), COPD (n=688), interstitial lung disease (n=274), bronchiectasis (n=109) and upper airway obstruction (n=40), and compared these with spirometry using data collected from a registry from across 13 hospital clinics in China. The authors concluded that compared to spirometry, respiratory oscillometry was more appropriate for evaluating, rather than diagnosing, respiratory diseases. The conclusion was based on the comparison
of Z-scores for area under the curve (AUC), sensitivity and specificity between forced expiratory volume in 1 s (FEV1) (spirometry) and resistance measured at 5 Hz (R5) (oscillometry) (AUC 0.900, sensitivity 74% and specificity 95.4% versus 0.807, 62.4% and 90.3%, respectively, for all respiratory diseases, and 0.820, 76.2% and 75.2% versus 0.788, 66.7% and 81.5%, respectively, for obstructive airways diseases). This is clearly one of the largest studies to date that has examined the diagnostic performance of oscillometry in real-life clinical practice; however, we argue that the Z-score methodology used to compare diagnostic performance of oscillometry with spirometry is not appropriate and therefore misleads the interpretation.
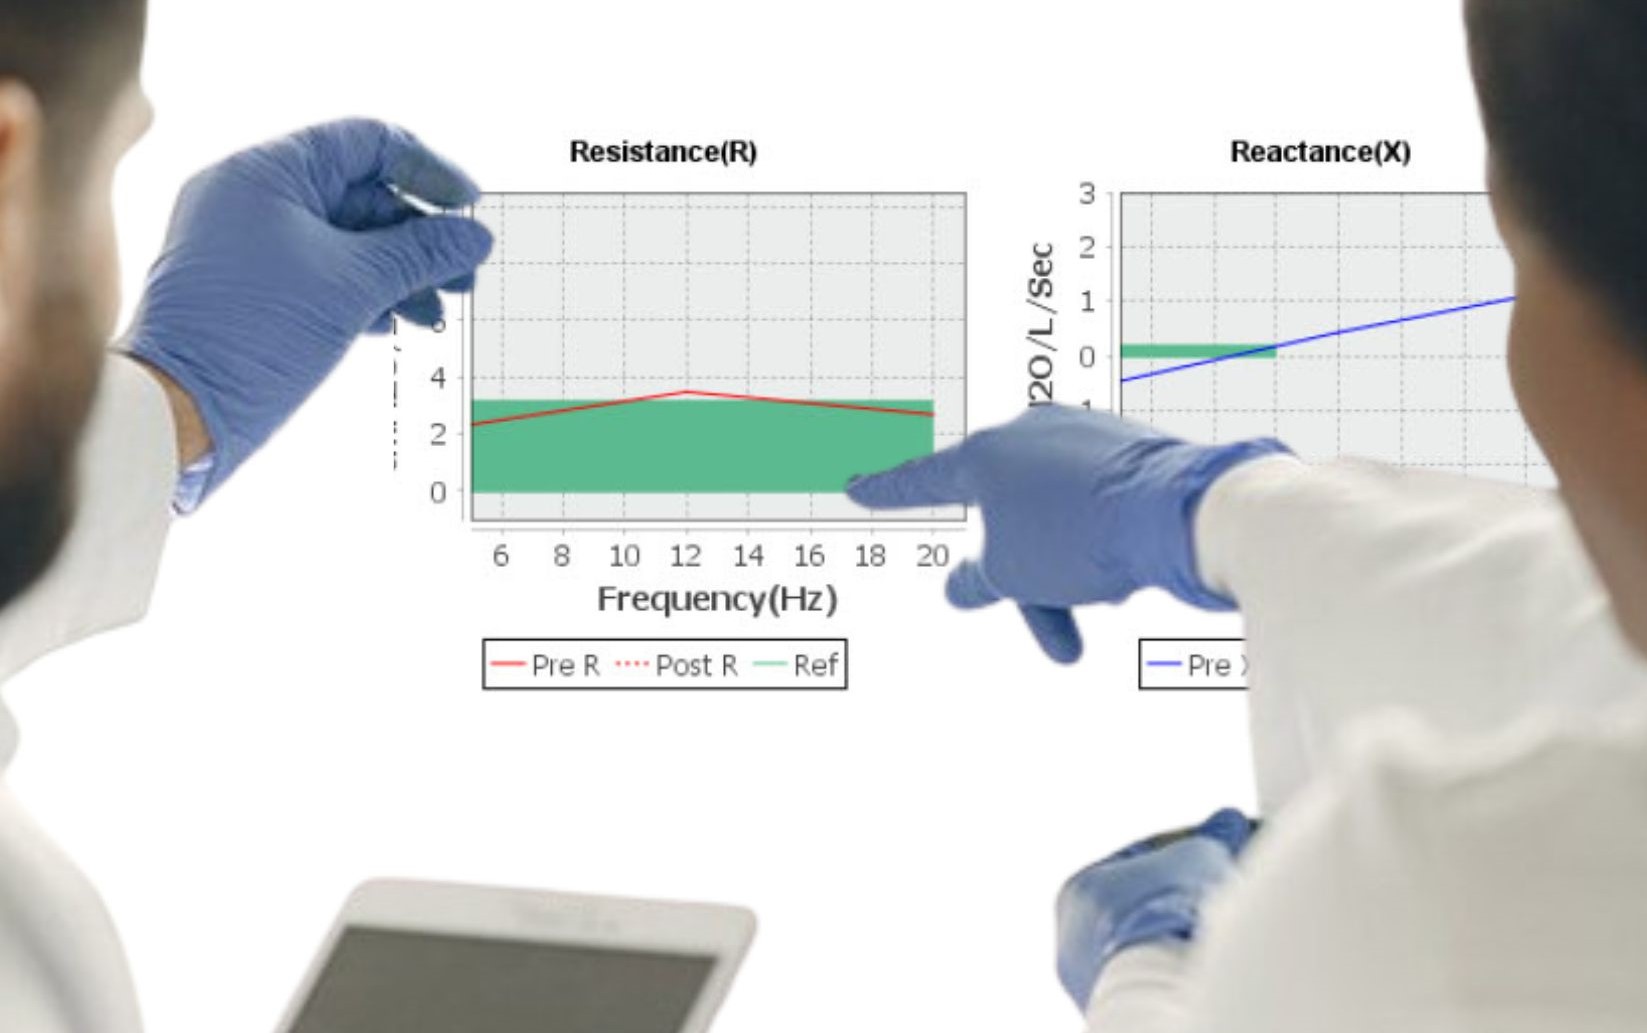
Lung oscillometry is a simple, noninvasive lung function test where multiple frequency pressure waves are forced into the respiratory tract superimposed over normal tidal beathing. The measured output is respiratory impedance, a combination of total respiratory resistance and respiratory reactance measured at different frequencies. In addition to providing information about airway resistance across central and peripheral airways, it also throws light on the mechanical properties of the lung and therefore complements existing tools such as spirometry. While reproducibility and technical training remain challenges, lung oscillometry is predicted to be a useful diagnostic tool with a bright future for diagnosing various respiratory disorders [2, 3].
Spirometry is currently the gold standard diagnostic tool for evaluating lung function. Its key parameters, FEV1 and forced vital capacity, are normally distributed in the healthy population, and these indices are strongly dependent on gender, age, height, weight and ethnicity, which together contribute to a high coefficient of determination value (R2) between 0.7 and 0.9. For a given set of these determinants, the expected value reflects the central tendency around which observed values are normally distributed. Z-scores reflect the deviation from the expected and its probability within the healthy population distribution, and are therefore widely used to determine the presence of respiratory disease and its severity. In contrast to spirometry, oscillometry indices (R5, R5−R20, reactance measured at 5 Hz, area of reactance and resonant frequency) are not normally distributed in the healthy population and the variables that drive spirometry predicted values (gender, age, height and weight) show poor coefficient of determination for oscillometry, with R2 values between and below 0.15–0.25 [4–6]. LIANG et al. [7] have earlier reported reference values for oscillometry from the current study population (567 healthy subjects) and showed that oscillometry parameters were not normally distributed and that R2 values for age, height and weight ranged from 0.01 to 0.25. We have also shown in a large healthy adult population from India (n=1200) that age,
height and weight show R2 values ranging from 0.06–0.20 (unpublished data). Sex and height were the only variables that showed a modest contribution to the predicted equation. Despite the presence of skewed data, interpretation of oscillometry is still recommended using Z-scores [8]. If expected values do not truly reflect the central tendency, around which observed values are normally distributed, calculated z-scores would no longer accurately reflect the probability of being within the healthy distribution. Low coefficient.
Shareable abstract (@ERSpublications)
Instead of using % predicted values or Z-scores to define and quantify respiratory abnormality in oscillometry, fixed cut-off values will likely give more accurate discrimination https://bit.ly/3vVmIyE
Cite this article as: Salvi S, Ghorpade D, Vanjare N, et al. Interpreting lung oscillometry results: Z-scores or fixed cut-off values? ERJ Open Res 2023; 9: 00656-2022 [DOI: 10.1183/23120541.00656-2022].
| TABLE 1 Sensitivity, specificity and area under the curve (AUC) for fixed cut-off values to differentiate between healthy and obstructive airway disease (OAD) | |||||
| OAD | |||||
| Parameter | Cut off, cmH2O·s·L−1 | Sensitivity | Specificity | Overall accuracy | AUC (95% CI) |
| R5 | ⩾4.07 | 0.82 | 0.62 | 78.5% | 0.81 (0.69–0.94) |
| R20 | ⩾3.05 | 0.61 | 0.69 | 62.4% | 0.75 (0.62–0.87) |
| R5- R20 | ⩾1.01 | 0.83 | 0.62 | 78.5% | 0.76 (0.63–0.89) |
| X5 | ⩽ −1.01 | 0.89 | 0.50 | 82.8% | 0.84 (0.74–0.93) |
| AX | ⩾4.07 | 0.83 | 0.625 | 78.1% | 0.74 (0.58–0.88) |
| R5: resistance measured at 5 Hz; R20: resistance measured at 20 Hz; X5: reactance measured at 5 Hz; AX: area of reactance. | |||||
of determination and non-normal distributions for oscillometry suggest that this may be the case. It is also likely that spirometry was used for diagnosis of other groups. If oscillometry were to be more sensitivethan spirometry, it would be likely to suffer from false elevation of the upper limit of normal in this design with a corresponding reduction of AUC and loss of sensitivity when using z-scores.
Given these biases, instead of using per cent predicted values or Z-scores to define and quantify respiratory abnormality in oscillometry, fixed cut-off values will likely give more accurate discrimination. In a small adult population (n=93) comprising healthy, asthmatic and COPD patients, we recently observed that single cut-off values for oscillometry indices showed reasonably good accuracy, sensitivity and specificity for differentiating between healthy and obstructed airways with the Antlia FOT device (Icaltech, India) (table 1). As more data become available, the cut-off values will become more finely tuned (different devices may, however, require different cut-off values). Several authors have also pragmatically used
absolute cut-off values in adults for defining disease states on oscillometry instead of Z-scores [9–13].
It seems that the mechanical properties of the lung behave relatively uniformly across adults of all age groups, although gender and height have modest roles. Like blood pressure, blood sugar and several other biochemical parameters, where single cut-off values are used to delineate between healthy and diseased states, it seems that oscillometry interpretation will (or should) also follow this pattern. If that is the case, then interpretation of oscillometry in adults will be a simple affair based on single cut-off values and this will further add to the distinct advantages that it has over spirometry.
Sundeep Salvi1,2, Deesha Ghorpade1, Nitin Vanjare3, Sapna Madas1 and Anurag Agrawal4
1Pulmocare Research and Education Foundation, Pune, India. 2Faculty of Health Sciences, Symbiosis International University, Pune, India. 3Department of Connected Devices, IQVIA, Thane, India. 4Ashoka University, Sonepat, India.
Corresponding author: Deesha Ghorpade (deesha.ghorpade@yahoo.in)
Provenance: Submitted article, peer reviewed.
Conflict of interest: None declared.
References
1 Liang X, Zheng J, Gao Y, et al. Clinical application of oscillometry in respiratory diseases: an impulse oscillometry registry. ERJ Open Res 2022; 8: 00080-2022.
2 Calverley PMA, Farré R. Oscillometry: old physiology with a bright future. Eur Respir J 2020; 56: 2001815.
3 Kaminsky DA, Simpson SJ, Berger KI, et al. Clinical significance and applications of oscillometry. Eur Respir Rev 2022; 31: 210208.
4 Deesomchok A, Chaiwong W, Liwsrisakun C, et al. Reference equations of the impulse oscillatory in healthy Thai adults. J Thorac Dis 2022; 14: 1384–1392.
5 Moitra S, Moitra S, Ghosh AK, et al. Reference values of impulse oscillometry (IOS) for healthy Indian adults. Int J Tuberc Lung Dis 2020; 24: 536–539.
6 Guo YF, Herrmann F, Michel J-P, et al. Normal values for respiratory resistance using forced oscillation in subjects >65 years old. Eur Respir J 2005; 26: 602–608.
7 Liang XL, Gao Y, Guan WJ, et al. Reference values for respiratory impedance with impulse oscillometry in healthy Chinese adults. J Thorac Dis 2021; 13: 3680–3691.
8 King GG, Bates J, Berger KI, et al. Technical standards for respiratory oscillometry. Eur Respir J 2020; 55:1900753.
9 Li LY, Yan TS, Yang J, et al. Impulse oscillometry for detection of small airway dysfunction in subjects with chronic respiratory symptoms and preserved pulmonary function. Respir Res 2021; 22:68.
10 Liu Z, Lin L, Liu X. Clinical application value of impulse oscillometry in geriatric patients with COPD. Int J Chron Obstruct Pulmon Dis 2017; 12: 897–905.
11 Lipworth BJ, Jabbal S. What can we learn about COPD from impulse oscillometry? Respir Med 2018; 139: 106–109.
12 Kim SR, Park KH, Son NH, et al. Application of impulse oscillometry in adult asthmatic patients with preserved lung function. Allergy Asthma Immunol Res 2020; 12: 832–843.
13 Chaiwong W, Namwongprom S, Liwsrisakun C, et al. Diagnostic ability of impulse oscillometry in diagnosis of chronic obstructive pulmonary disease. COPD 2020; 17: 635–646.